Wednesday, 5 January 2011

My letter to the Three Kings

In Spain little (and not so little) children get their presents from the Three Wise Men on January 6th and not from Santa or Saint Nicholas. In order to get their preferred gift, they need to write a letter, telling the Three Kings that they’ve been good last year and then they list their most wanted gifts.

Here’s my letter and request for gifts.

Queridos Reyes Magos // Dear Three Wise Men.


I think I’ve been a good on-line marketing and analytics boy this past year for the following reasons:

I’ve segmented, targeted and tested, reported and optimized. Reporting, analyzing, providing Insights and putting all this in improvements has been great this year. We did a couple of A/B tests, started to measuring the opinion of our visitors. We dug deep into the data and based our decisions on these data. I’ve also very much enjoyed the ‘urgency’ that comes with working for e-commerce sites.

Dear Wise Men, please give me this year the same challenges and tools to use data to improve customer satisfaction and revenue. Let’s improve and let’s convert!

I’ve been trying new tools this past year: Unica Netinsight (my own reporting tool: creating reports and defining variables), Google Analytics (always improving), WebCEO, 4Q (Voice of Customer, hurrah!), AddThis and ShareThis (great new analytics tools, both of them), MouseTrace (let’s keep an eye on them).

Dear Wise Men, please give me new tool, new ideas how to use them and new developments from the providers of the tools to test, to use and to help with improving. High on my list are Optimizer and Crazy Egg.

I’ve read books and blogs in 2010.
The best post was, without any doubt the Anchoring Effect from You Are Not So Smart. About how our mind uses anchors (like ‘original prize’) guide us to estimate prices or numbers. Greatly written, very well explained, mindblowing.

I’ve also enjoyed a couple of books, like the classic The Long Tail by Chris Anderson.

Also The Stranger’s Long Neck by Gerry McGovern was very interesting, making a defence of and presenting a method on improving Task Management.

Dear Kings, please give me new posts all-day, every-day to read and read and time to read it all. I mostly need time to read Web Analytics 2.0 and Cult of Analytics.

The past year I’ve also been a good boy, since I’ve written in my blog. I even got some kind of small audience, and even the search engines are giving me some traffic to some popular posts.

Please Wise Men, give me time and inspiration for this year to write interesting posts which are useful for my readers. I especially want time for a series of posts on Web Analytics and statistics. The idea is there, I just need the time. I might even want to squeeze a White Paper out of that idea.

I must say that I dedicated a lot of time to my passion, the Internet. Please Wise Men, don’t stop giving me more Internet, more to explore, more new stuff to start using like my foto-blog on tumbr. A good start for enjoying Internet in all it’s glory was the new job I found via twitter. I got that in advance, thank you Wise Men!

On a more personal note, I’ve been dedicated in using and updating the pretty cool Runkeeper to keep up with running and working out. Please Wise Men, let me keep using Runkeeper to get rid of those 5 kilos.

Please, Three Wise Men!! Pretty please??

Tuesday, 4 January 2011

A very quick look back on 2010.

1. The Internet is mine! We owns it!
2010 news year’s hangover had just gone away, and we already had to deal with the funniest moment of the year: the speech of the CEO of Telefonica, the biggest Internet Provider in Spain. Really sorry that it’s in Spanish, but it’s too funny to leave it out.
The argument of this CEO is that his company Telefonica, as Internet Provider, ‘owns’ the Internet and since they do everything (infrastructure, customer care, after-sales, billing,…) companies like Google (who just have algorithms and don’t do anything) should start paying fees to Telefonica (and AT&T) for the use of their networks. In February he assured that Internet companies would start paying such fees in 2010; since this didn’t happen, maybe it’s a sigh that he doesn’t really get it.


2. Science Investigates Usability
It was nice to see this summer (thanks to the great blog of TalleresSEO) that Scientific Investigation investigates the Internet and at Usability.

A study was published that gave a new look at the eye-tracking (where people look at on an internet page) of search result pages.

The study is pretty amazing, since it segments different search behaviour: it separates search results for people who search for information, search for navegation or search for transactional reasons. Of course, the behaviour is different for each segment (people who search for transactional reasons do look at the AdWords on the right hand side). Hurray for Segmentation!


The fact that science studies this is amazing: they’re the specialists in investigation, in methodology, in designing experiments, in doing statistical analysis. Such a pity then that there seems to be a mayor methodological error in this paper: Marcos & González-Caro conclude that people search for information or search to navigate, don’t look very much to the Paid Results, and they note that ‘this might be because in some cases of our experiment there weren’t any Paid Results‘… Now how can you conclude that somebody doesn’t look at something, if it’s not even there in many cases? It’s a bit too obvious that they don’t look, right? I’m not a scientist, but I would say that you have to contemplate 2 cases: How people behave when there are Paid Results and how people behave when there aren’t. Putting data together of people who hade a result page with paid results and others without them and then concluding that people don’t look at them, seems like a mistake to me.


You can download the whole study here. Sorry, again in Spanish, though with abstract in English.

3. Google Instant Launch
Methodological mistake or not, the results of the study discussed above were soon out of date, since Google decided to update the result pages. It Launched Google Instant: the Search results were automatically updating while you type, changing the way we use Google’s Search Engines. It came as a pretty big boom, but even the week later, it felt like something so natural, so useful and natural that it was instantly a Google classis. Later they launched Google Preview, with the same effect: like you can’t remember that it once wasn’t there.

The launch of Instant was also very Google and very beautiful: 2 doodle (modified logos of Google on the Search page) showed what Google was up to: it could change his page while you interacted with your mouse and with the Search Box. 


4. Second funniest moment of 2010

Hell yeah: why did anybody bother with developing web pages since 1997, when you see how perfectly this site is designed. 


5. Facebook gets real
Facebook has been a while with us, and for a lot of people it has just become a part of our lives, just like email has been for a long time: you have it, you use it, no big thing. We use FB to send messages, chat with friends and upload some pics. But Facebook might just become a real player in Internet in 2011, starting to use the power it has to innovate so many things. I realised that when I read this article from Blind Five Year Old on ‘Organic Search’ results in Facebook.

In short:
  • Facebook has already an equal number of daily searches as Google. They’re mostly searches for friends or groups, but the potential is there.
  • We use Facebook a lot, so using the search bar within Facebook might be easier then going to another page to search.
  • Facebook has these ‘Like’ buttons on a lot of pages. These are very good indications of what you or your friends like, and gives FB a nice tool to index pages using these ‘Like’ buttons in a social way. If a lot of people like a page, it might be good result in searches.
  • Facebook already puts search results of external sites for its searches, so it will be a case of developing and Google Search might have (at last) a real competitor.


It is often said that Google might not really understand Social, but Facebook might as well understand Search. And Google still gets a very large part of it’s income from search.

The whole article (pretty techy, actually):

Happy New Year!

Thursday, 2 December 2010

On-line Surveys: Best Practices and Sky.com example

I'm a BIG, BIG fan of on-line surveys. To make a really great website, you need to find out why people come to your site and if they find what they're looking for. The easiest way to find out what somebody wants is to ask him: say hello to on-line surveys.
If you launch a survey, you'll find that a lot of people are very willing to give their opinion and will give you very valuable and actionable feedback.

To give you a quick list some things you can expect using on-line surveys:
  • You can find out what the priorities of your visitors are and take action.
  • You can find out what people can do on your site and what they can't and take action.
  • You can find out what people like on your site or what they don't like and take action.
  • You'll find out how many visitors already purchased on your site and take action.
Let's look at a practical example.

Recently I visited the site of Sky UK, the provider of satellite TV and related telecommunications services. When visiting the section on High Definition, a little window popped up on my screen asking if I want to help with a little survey.


I really like this way of doing surveys: you ask a real-time visitor to help filling out the survey at the end of their visit.

How does this work?

When you accept to do the survey, a new window opens underneath your browser and you're asked to answer the questions at the end of your visit.
This is double-clever: first you invite a visitor in real time while he's busy visiting your site. This is: your visitor is having a real-time and real-life experience with your site. There is no better audience then this one to give you feedback.
And second, you'll ask the opinion of the visitor right after he visits. Not an hour after, not a day after: right on the spot, seconds after visiting your site.

If you accept to participate in the survey, you'll see something like this:


Good Practise 1: Be brief

During the survey, you're asking somebody's opinion which means that you're asking time and effort. So be a good boy or girl, and don't abuse of the good intentions of your visitors: ask what's necessary, be brief. And in case you want to ask a lot: launch various surveys to different people. Better to ask 10 questions in 3 different surveys then 30 questions in 1 survey.

Good Practise 2: Be transparent

A good idea for being transparent is using a bar indicating the progress of the survey. Your visitors will be grateful to know how much time they'll need to complete the survey.

Looking back at second screenshot, you'll see that the first question of the survey was: are you a client or not? This brings us to:

Good Practise 3: Segmentation

You're going to ask a number of different visitors what they think of your site, and you better be sure not all of your visitors are the same. Socio-demographic segmentation is very important, the question on being client or not is something else. You try to found different types of audiences on your site. This is a very important difference for any type of site. For an e-commerce site like Sky.com, the difference between client or not is very relevent: you'll want to give different services and content to these different groups.
For a site like Amazon, you might want to ask if the user already purchased before on the site. For a site like BMW.com, maybe you want to ask if the visitor will be purchasing a new car in the next 3 to 6 months. How to best segment, depends on your business and it might take some brainstorming to see how best to implement this question.

Next question on the Sky Survey was this one:


Good Practise 4: Task Management

This is a good one: why did you come to visit this site? This is the purest form of Task Management: you can consider that every visitors comes to your site with a purpose, and you just ask what this purpose is. The free on-line survey 4Q is based on this idea: it asks why you came to visit the site and if you were able to complete the task.
That's so great: in that way you get to know why people come to visit your site (look at video, find offer, compare with competitor, download form,...) and what tasks are doing good (=visitors gets to download the for he's looking for) or not (=visitor doesn't find prices to compare with your competitor). This is called Task Completion Ratio: what percentage of visitors interested in a specific task get to complete that specific task.

Unfortunately, Sky didn't ask the Task Completion Ratio. It just asks what the main reason is for you to visit your site and moved on to the next question.


Good Practise 5: Ask about site-goals.

This 'Did you purchase'-question is not a bad one: a site like Sky has a clear goal of selling subscriptions or upgrades to, for instance, their High Definition services. So it's pretty straightforward to ask if the visitor purchased that day.
But I think it's not very subtle. First of all, I suppose there are not so many people purchasing Sky HD the exact same day as visiting a site. It's not buying a car, but it's still a bigger buy then, say, a loaf of bread. Second, I suppose that Sky's web analytics or call center will already tell the ratio of purchases. Third, it sounds a bit intrusive: people know that Sky sells stuff, but it feels a bit premature and a bit pushy to ask directly if the visitor purchased.
But above all, I think it shows the interest of the company (to sell) and doesn't take in account that people could be in various stages of a purchase process. The survey doesn't take advantage of braking down the process in different steps and finding out what the satisfaction-rate of each step is. It just takes purchasing as final goal and that's it. If you break down a purcase process you can and defining goals for every stage of the process. These are called micro-goals, and every micro-goal adds to the main goal.

Good Practise 5 revisited: Ask about micro-goals

Next question:


The next question is again a good one. I would have asked for micro-goals (every step in the purchase process), but it's still good to ask why people didn't buy at this stage. This will give you an idea of what you can improve. But: if asking wether you purchased or not might seem a bit pushy, asking why not might even be worse.

Good Practise 6: Be action-orientated

The next question is a typical one, and I must say that I'm not a fan. The question is: what would you change on our site?


In my experience, people don't normally know what needs to be changed on a site and you'll probably end up with some answers which aren't actionable.
For instance: if somebody answers on the survey that he wants more info on HD – how would you change your site? 'More information' is something very general and  you don't really have a clue of where to start. When a lot of people ask for more information, your manager might ask you to publish whatever information you can get your hands on. So in no time, you'll get a site impossible to manage or to navigate, probably full of useless information. It might be a lot more useful to know that a visitor was trying to find out if he could watch the World Cup in High Definition and that he couldn't find the information necesary. Now that's actionable information.

If the last question wasn't actionable, the one following is really company-focused and not at all customer focused. Before you read the question, take a deep breath:

Does the Sky HD section on the site make you think of Sky as a follower or a leader?

What? Can you repeat that question? Or maybe better: don't repeat the question and let me just close this survey-window and I'll continue with my own business. Bye!

Serious. I know companies are interested in knowing what people think of them, and what the 'core brand values' are. But is on quick on-line survey really the place to ask such questions? You can't waste your visitor's time. If you do, they disconnect and leave the survey unanswered.


Best Practice 7: Be customer centered

I'm sure you agree that the language in the question above is very company-centered. And it's not just one question: it's a whole list.
There is also another problem with that last question: When you ask people to answer on a scale from 1 to 7, people tend to put their score at the center, which makes the answers to your question pretty much not relevant. Gerry McGovern explains this in this white paper on surveys, arguing that scaling the answers are bound to give you incorrect feedback.
Another issue with scaled answers is that, on a scale from 1 to 7 some people will give a 7 for very good and a 1 for very bad, and others a 5 for very good and a 3 for very bad, even if they experience the same value of 'very good' or 'very bad'. You could say that some people answer more 'extreme' then others. Luckily there are techniques to overcome this, but make sure you use them.

The following question also uses scaling, but at least has a pretty relevant question: how satisfied are you with your visit and how likely you are to tell a friend about it.


Next up are some socio-demographic questions. These are very relevant for the segmentation talked about above.


Good Practise 8: Be consistent

Last is an invitation to subscribe on a emailing list for further surveys.


This is OK to do, but it's a bit dodgy: a lot of people are willing to give feedback for free, but they don't want you to take advantage of them. So if you promise that a survey will be anonymous, maybe it's better to be consistent with this promise and do not to ask personal data, not even e-mail.
The same remark holds for giving incentives to people for answering a survey: if you promise somebody a gift for helping with a survey, you'll need his address and name to send him his gift. So even if you don't cross this personal data with the answers of the survey, your visitors won't believe you when you say it's an anonymous survey.
In general, it's not necessary to give the participants of the survey a gift. People are very generous and are very happy to give you feedback and help you to improve, just for free. That's a very nice things so keep Best Practice 7 in mind: bo customer centered.

Good practice 9: Be polite
Say thanks at the end of the survey.


Sunday, 14 November 2010

Track click-backs from 'Share this in Twitter'

In this previous post I've explained how you can track the visits to your site, generated after someone shared the link of your page in Facebook. 
In this post, I'll explain the same thing for Twitter: say you have a link or a button on on your site or in an email, asking to people to share your site or offer with their friends in twitter. It's nice to know how many times your site is shared using this system. But it's even better to know how many new visits this sharing has generated. And if you can find out how many of these visits come to your site, it's easy to find out how many it added to your site goals like registration or downloading a demo.

I'll use Link Tracking for Google Analytics, but if you're using another Web Analytics tool, I'm sure you can 'translate' the campaign tracking for your own tool.

Twitter has a URL which let you share a link. The URL is the following: 

http://twitter.com/share?url=http://yourpagecomeshere

After the parameter 'url=' you insert the URL of the page you want to share. 

When publishing a link, Facebook actually publishes 4 things: the page title, the description meta-tag, the url and an image (in case it can find one on the page).
Twitter is more basic: it lets you share a URL and you can include some text, in case you want.

It's important to note that you can share any URL you like, it doesn't have to be the URL of the page the share button is on. This gives you obviously the opportunity to make a specific landing page for people who come to your site from twitter.

Let's see how we can track the click-backs from twitter campaigns:

Step 1. Define the page that you want to use as landing pages
Like mentioned above, you can use a specific landing page. This gives you the possibility to use a specific promotion or a graphic or content reference to twitter.

Say we want to share the URL of my previous blogpost:
http://stefvanef.blogspot.com/2010/11/analytics-for-sharethis-addthis.html

Step 2. Add Campaign tracking to the URL
To track the click-back, we're using the link tracking of Google Analytics. 

The UTM's we're going to use are these:
utm_source=Twitter
utm_medium=SocialBookmarking
utm_camapaign=ClickBackOfferX

So the URL we want to share is the following:

http://stefvanef.blogspot.com/2010/11/analytics-for-sharethis-addthis.html?utm_source=twitter&utm_medium=socialbookmarking&utm_campaign=clickBackOfferX

Step 3. Use a URL shortener
It's important to use a URL shortener for Twitter. You can only share 140 characters on twitter, and URL shorteners are a handy way to cut your tagged URL's short. The URL we want to share, as stated in number 2, is 151 characters, which is already 11 characters too long for twitter. Using bit.ly for this example, we shorten the 151-character URL to  just 20 characters:  

http://bit.ly/aRYLZT

So if we want to share this URL in twitter we're going to use this URL:

http://twitter.com/share?url=http://bit.ly/aRYLZT

Step 4. Add text to the message
A nice thing we can do with the Share-URL of twitter, is including a piece of text. 

You just need to include an extra parameter in the query string. A query string is the part of the URL which comes after the '?' of the URL. TO include text, which will be published on twitter, you need to use the text= parameter. After the parameter you can include the text you want. Black spaces are indicated with '+'.


When you paste this URL into your browser you get to see this:


Step 5. Publish the URL on your page or in an email

Easy, right? Here you have a button to share this post in twitter, and of course it's tracked to see how many people come back to visit this post after you've shared it on twitter. 


Related posts:

Track Click-Backs for Facebook:

Comparing Analytics for ShareThis, AddThis, AddToAny and SocialTwist

Monday, 1 November 2010

Analytics for ShareThis, AddThis, AddToAny and SocialTwist

You recognize the services offering Social Bookmarking and Sharing by the buttons you see announcing 'Share this in facebook' on many websites nowadays. When you use these services, you share a URL of a page on your favourite social network or email service. There are a lot of free services which cover an amazing number of services and in this post, I compare the Analytics features they offer.

The services I'm comparing in this post are:
  1. SocialTwist
  2. AddToAny
  3. AddThis
  4. ShareThis
All these 4 services offer all of the following features:
  • They include a huge list (some 300+) of social networks where the page can be shared.
  • They all do bookmarking and emailing.
  • They all come in a lot of languages.
  • The are all free.
One of the main differences is their approach to Analytics. When used the right way, these services can provide very good social media metrics: you can see how many times your site or page is shared and in which social media. You can track how many people click these shared links and how many visits your site gets back.
A lot has been discussed on social media metrics. Consider this a solid and important first metric when defining your KPIs for Social Media: how do people share your content and does it drive traffic to your site. It's not yet a metric which tells you qualitatively how people value your brand or site, but it's a first useful step.

Here are my findings of how the above mentioned 4 services offer Analytics.

1. SocialTwist
You can find the analytics for Social Twist ('Te!! a Friend') within their own site: you create a login to get the service and the stats are found within the platform. For the free subscription, you just get to see the times your page or site was shared in 'Social', 'Bookmark' or 'Email', without any breakdown. And you get to see what is the most used service, but not more. You can upgrade to a 'Pro' account (100$ each 1000 referrals) and you can get more detailed analytics. Social Twist doesn't offer integration with Google Analytics or any other Web Analytics platform. You can't measure traffic coming back from the times your page was 'shared'.


2. AddToAny
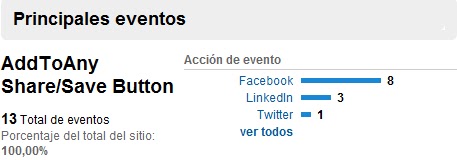
AddToAny doesn't have any statistics on their own platform, but they do have an integration with Google Anlytics. The integration is automatic: as soon as you have a Google Analytics script on your page, you get the 'Shares' tracked as events. AddToAny doesn't offer a way to track if people get back to your site after it was shared.


Little parentesis: AddToAny is the only one of the 4 who let's you share on Tuenti. Tuenti is a ver important social network in Spain, and it's quite amazing that the other services just doesn't offer this option on their platform. Why?

3. AddThis
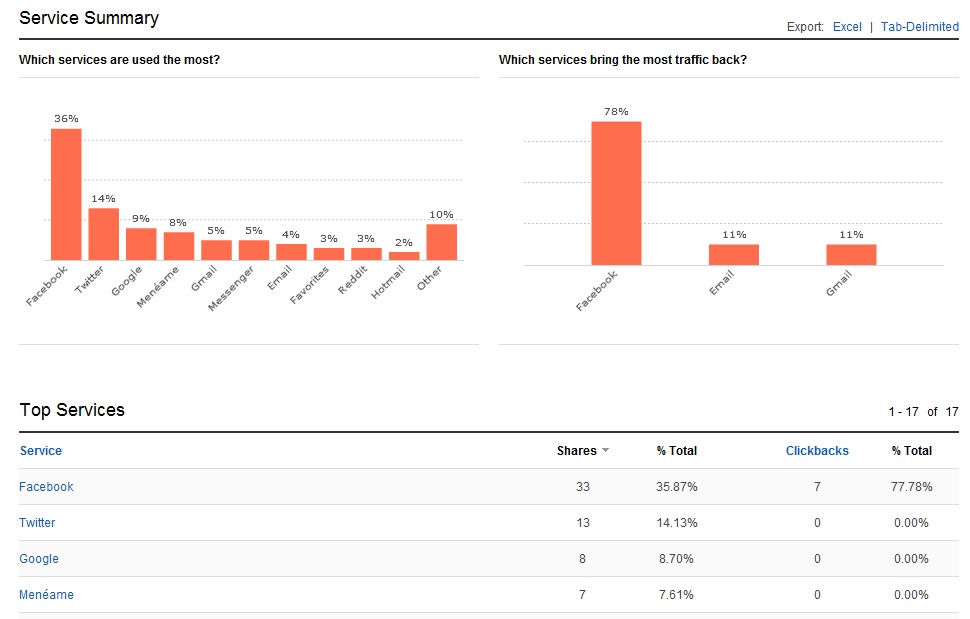
AddThis is good on analytics. You have a very nice interface on the AddThis site using your login. You get different features: top shared content, tops services used, geography.
You also get to see Click-backs: the number of visits who come from people clicked a shared URL of your site.
There is a pretty easy integration with Google Analytics, and you can also integrate it with Omniture.


On top of that, there is a freely accessible application which shows the most used services over the world, you can breakdown and compare countries, and every service has a little 'resume' which shows you where it is popular. A lot of data, which you can access here. Do you know what services are mostly used in your country?


4. ShareThis
Social Twist and AddThis give you some data, AddThis is better since it offers some analysis. But ShareThis is the one who goes all the way and provides real insights based on 'Shareing' behaviour.
First of all, ShareThis does everything that AddThis does: their own site has an analytics dashboard, and you have integrations with Google Analytics and Omniture.
They have something called 'Social Reach', which is very similar to what AddThis calls 'Click-Back': it measures how many people click on the links which are shared via ShareThis.
But the really BIG thing is this: ShareThis is the most used service of sharing, and is now starting to use all this data to give something as precious as competative analysis. You can actually compare the data from your site with data from similar websites: for instance, I can see how my blog is doing compared to other small blogs.
Second, I can check how my site performs versus other sites from my catagory (for example, you can compare against 'Automotive'). And ShareThis is even working on a 'know-your-audience' feature, which indicated that your site is popular for sharing for people interested in, say, 'Music' and 'Family'.


2 Important Remarks

1. Data integration is important, so I completely understand that some people will argue that another analytics interface might not be what is needed right now.
2. Note that all 4 features are external services. So when using them, you are giving access to your site to an external provider to obtain data. The competative analysis features from ShareThis can work in your advantage, since you can compare your data with competitors. But it is important to think about provacy and sensative data you are actually giving away for free.

So what's next?
If you'd ask me, we're missing a feature which measures Click-backs or Social Reach crossed with the conversion of our site goals, like brochure downloads, access to a demo, or buying a product. It's nice to know your site is shared in social media, it's better to know that people click on the shared link to come back to your site. But no doubt, it will be massive to see how many of the people coming back to your site via facebook convert in prospects. Since the sharing scripts are implemented on almost all pages, and they track which pages are shared, it can't be too difficult to let site-owners define what the goals on their site are and integrate them on the analytics dashboards.

¿Who will be the first to provide this feature?

Related post:
Track click-backs from Facebook


Share this post:

Sunday, 24 October 2010

Track click-backs from 'Share this in Facebook'

On almost every web page today, there is some kind of 'Social Bookmarking' installed. Social Bookmarking is the method of posting a site or a page in a social network, like Twitter or LinkedIn. Every time you press a link which says 'Share this with your friends in Facebook' you are 'social bookmarking'.
What you actually do with social bookmarking is posting a link on your wall in facebook or on your twitter status. This is important for people managing a website. First of all, every link counts as an incoming link, which is good for Organic Search results (SEO).
But maybe more important: it means an extra links to your site, which can mean extra visitors and extra conversion/subscriptions/revenue for your site. And it's very probable that you get good quality visitors: a friend has recommended  to visit the page, and a friend's recommendation is always a good thing.

It's impressive, which so much links and external provider offering solutions for Social Bookmarking, that so few people actually bother with trying to measure how many people actually get back to your site from a Social Bookmark.

In this post, I'll explain how to measure the incoming traffic for visitors coming from social bookmarking on Facebook. This is: somebody shared a link of a site on Facebook, and one of his friends or connections sees the link and clicks on it to visit the site.

¿How does social bookmarking on facebook work?

Sharing a link on Facebook is very easy: you just need to use the following URL:

http://www.facebook.com/sharer.php?u=here-comes-the-url-you-want-to-share

After the parameter 'u=' you insert the URL of the page you want to share. Say that I want to share the blog of my friend Michael Notté, Kaizen-Analytics, then I need to use the following URL:

http://www.facebook.com/sharer.php?u=http://www.kaizen-analytics.com

It's interesting to note that you can include every page on a share this link or button. It doesn't have to be he page where you put on the link or button hat needs to be shared.

When you use this URL, say as a text link or a button on your site, you'll get to see this:


As you can see, there are 4 things published by facebook:

The title of the page
The URL of the page
A description of he page
An image found on the page

The title and the description are both taken from the so-called 'Meta Tags' of the page. For every page you can give a small title and a description. This is generally used for search engines: the 'title' is what you see in blue on a page of the search results and the 'description' is the little bit of text you see on the page of the search results.

This is good to know: you can make a separate 'landing page' for sharing in facebook. Like you've seen above: you can implement any URL in the facebook-share page so technically there is no problem using any URL you choose. So you can make a personalised landing page, in which you can personalize the Title and the Description as you please. This can be a nice way to make a special offer to somebody who comes 'recommended by a friend'.

It's not really clear on what basis facebook selects the images you get to share with the URL mentioned above. But it looks like it just takes all images from the body of the page and you can change to the one you like most.

The trick for measuring the incoming traffic from this link mentioned above is the URL. Instead of including just the link of the page we want people to share, we're going to add some parameters to the URL so that, when somebody clicks on the URL, we can track this.

How to measuring traffic from the 'Share his': Link Tracking

Link tracking is a pretty simple method to track visitors coming to your site. You simply add some parameters to your URL, and when somebody visits your page, with a URL that holds these parameters, we can pick this up in our Web Analytics tool and soon you'll see where your traffic is coming from.

In this example, I implement link tracking for Google Analytics. I think everybody who uses a Web Analytics tool which is not GA, knows the idea behind Google Analytics link tracking and I'm pretty convinced everybody will be able to translate this method to their own tool.

Step 1: Create the campaign parameters (UTM's)
Google Analytics gives you the possibility to include parameters in the URLs that you use to drive traffic to your site. These parameters are called UTM's and you can use a different number of parameters. As a standard, Google Analytics uses 3 basic parameters. If needed, you can add more.
The 3 are:
Source: where the traffic is coming from, like another the site or a search engine.
Medium: the method used for driving traffic, like 'email' or 'banner ad'.
Campaign: whatever you want to call your campaign, like '10€Offer' or 'ProductXLaunch'.

In the case of the click-backs for Social Bookmarking in facebook, I use the following UTMs:

utm_source=Facebook
utm_medium=SocialBookmarking
utm_camapaign=ClickBackOfferY

The campaign I've called ClickBackOfferY, since I need to know this is a click-back after sharing, and I've included the 'Offer Y', which can help you in case you have a special offer linked to the sharing of the page. You could also include this in an extra UTM, the UTM_content=OfferY.

Step 2 Add the UTM's to the URL
Now we add the parameters to the URL. Say that the page you want to share is 'http://myoffer.com', then the URL with Link Tracking will be:

http://myoffer.com?utm_source=Facebook&utm_medium=SocialBookmarking&utm_campaign=ClickBackOfferY

Step 3 Implement the URL in the facebook URL

Once we've created this URL, which will be the URL we share in Facebook, we implement this into the URL for sharing

http://www.facebook.com/sharer.php?u=http://myoffer.com?utm_source=Facebook&utm_medium=SocialBookmarking&utm_campaign=ClickBackOfferY

Easy, right? Why don't you just try to share this article with your facebook friends using this 'Share this' button below and you'll see how this works: I've implemented the system explained in this post!


Saturday, 16 October 2010

Congreso de Internet Madrid: online prizedraws


The upcoming weekend of 22, 23 and 24 of October there is a Congress on Internet being held in Madrid. The speakers look pretty good, and it's just 75€ for the 3 days, so that's not too expensive. If you want to go: feel free.

I'm not going, I'm afraid. But I do have a particular reason for writing on the congress: every blog-post written about the congress enters in a prize-draw to win an iPhone 4. I'm reading Freakonomics right now, a book in which is argued that people respond to incentives. And thus: the change of winning an iPhone was the incentive for me to start writing. The only thing I have to do is punt a link to the congress's website to enter the prize-draw, so here you go:


My duty is done. I'm on the ticket for the prize draw.

The congress also has another prize-draw in which you can win an iPad, which interests me more actually. To enter in the draw, you just had to upload a static banner on to your blog or site, so that's why on the right hand side of my blog you can also see the banner for the congress: the incentive is winning an iPad, I want an iPad so there you go: banner published.

Why does a congress want people to put banners on their site and place a blog post on their blog?
  1. If people put a banner on their sites for free, you get free advertising and free visits. You would normally have to pay to have banners on websites which drive traffic, but this way it is free. In this case free is not completely free: the cost is that of an iPhone4 and iPad.
  2. If people talk about your congress or event on their blog, you get free publicity. Instead of sending out a press release in the hope that some journalist will pick it up to publish something in a magazine or journal, you have - again - people who talk about you for free. Other people read about this and talk about it to other people. This way you get a viral effect in which 1 blog is read by 10 people who each tell it to 10 other people. At least the congress hopes this viral effect will work thanks to the prize draw.
  3. If various sites and blogs link to your site, you get a good positioning in Organic Search (SEO). This is what is called 'Link Building' and is a very specialized area of working search engines: with different techniques, you try sites to link to your site. Prize draws are one possible technique, though maybe just a temporary one, which is not that good for SEO, actually.
  4. It's a fun idea to organize an original prize draw.
As an on-line marketer I've organized various prize draws. Most were on-line games. In my experience, you reach a very specific and loyal audience (read: the same people over and over), but it's hard to get out of this small circle of participants.
Also in my experience: people will always cheat. The winner is very probably a cheater and it's pretty hard to exclude cheaters.

Cheating goes from using multiple user names until cracking your flash programming so a cheater reaches a stage in your game in a time which is less then the possible time. I've seen it all.

Of course, giving your prize to a honest participant may not be a worry to you: maybe your just interested in link building, and it doesn't really matter in the end how honest the winner may be.

So are there cheaters for the prize draws of the Congress de Internet? It's not that hard to create a blog or a new section of your site in which you talk about the congress, so it's easy enough.
But it's different here: the the congress just want banners on sites and post written about it, so it doesn't matter if the same person puts a banner on 3 different blogs which he manages. That's how it goes for the businesses who organize the prize-draws: you measure the number of participants, the interactions these participants had with your brand. Giving the prize to a possible cheater is just the prize for your efforts.

Probability

So will I win? Probably not. But there is a chance.
When I posted the banner on this blog, there were 55 people trying to win the iPad and 33 the iPhone. Since that time, there have been more people joining, but let's say those 55 for the iPad and the 33 for the iPhone where the final entries.

So these are my chances:

Winning an iPad: 1,82%
Winning an iPhone: 3,03%

So I have almost double the chance of winning an iPhone. It's also good to have 2 chances of winning.

Obviously, the more people join the draw, the less probability to win. But your chances just drop exponentially. This means that your chances drop a lot faster when there are just few people are playing and a new one enters the draw. If there are just 3 people playing, you all have a 33% chance. If somebody else joins, you all drop to a 25% chance of winning. This is a drop of 8%. If instead of joining 55 people for the iPad, there are 56 people playing, my chances drop from 1,82% to 1,79%, which is just a drop of 0,03%.

But make no mistake: it's always better to be with fewer people to join.
Here you have a plot of the chances you have when entering a prize draw like the one that I'm playing in.

Though it's a pretty remote chance, if there were 10.000 participants, I'd just had a 0,01% of chance to win.

I'll let you know if I win something.